

Performance Center starts on your Summary tab. See your performance for the week, month, year, or all time, and flip between money and units with one tap. Want to show it off? Tap share.
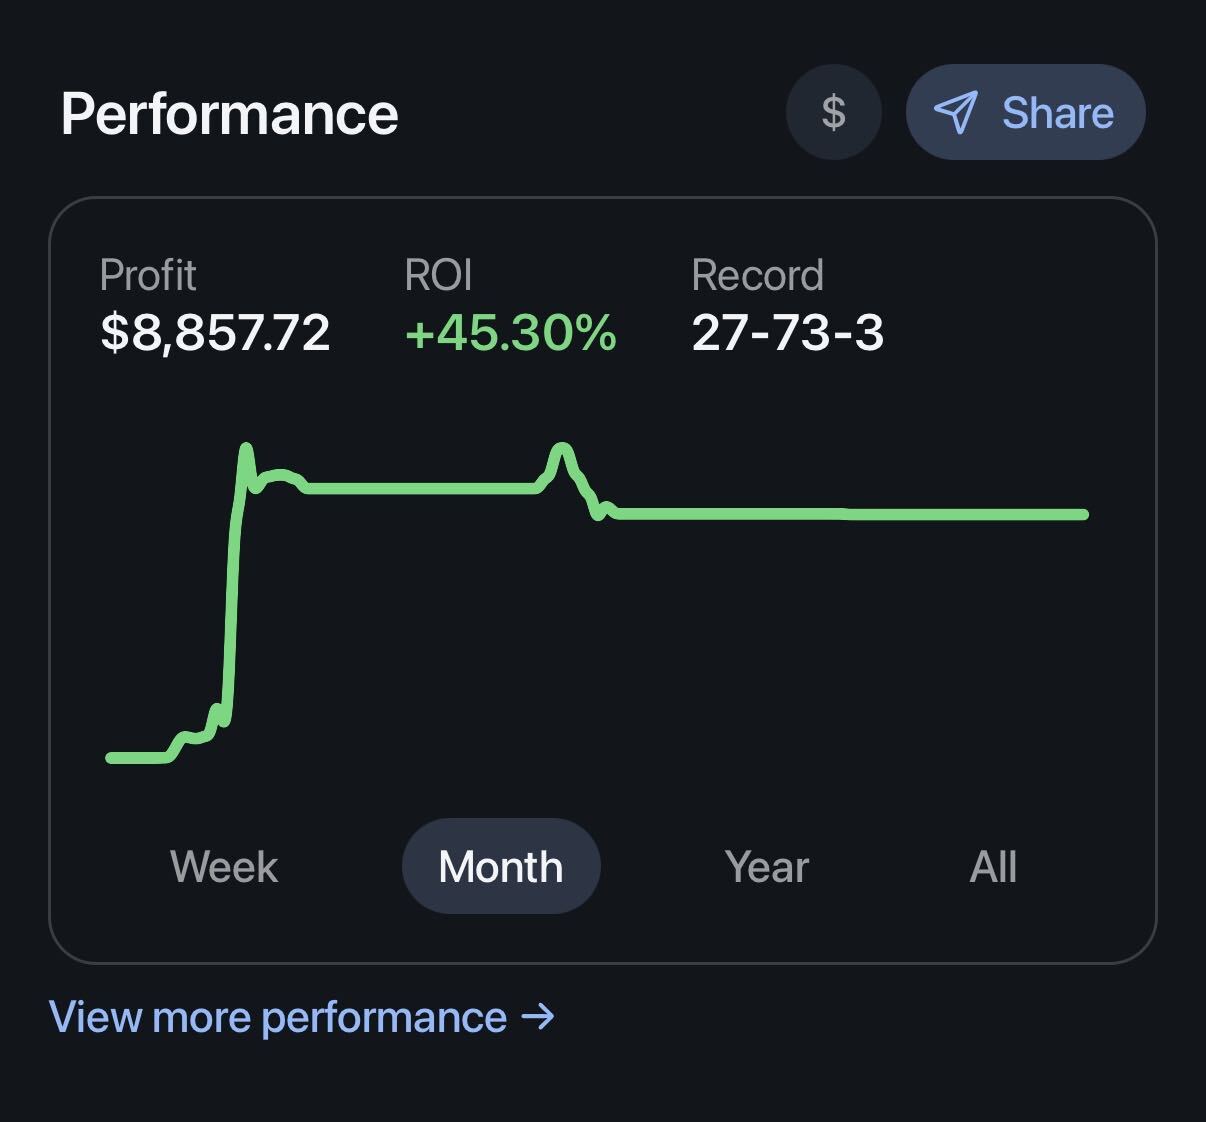
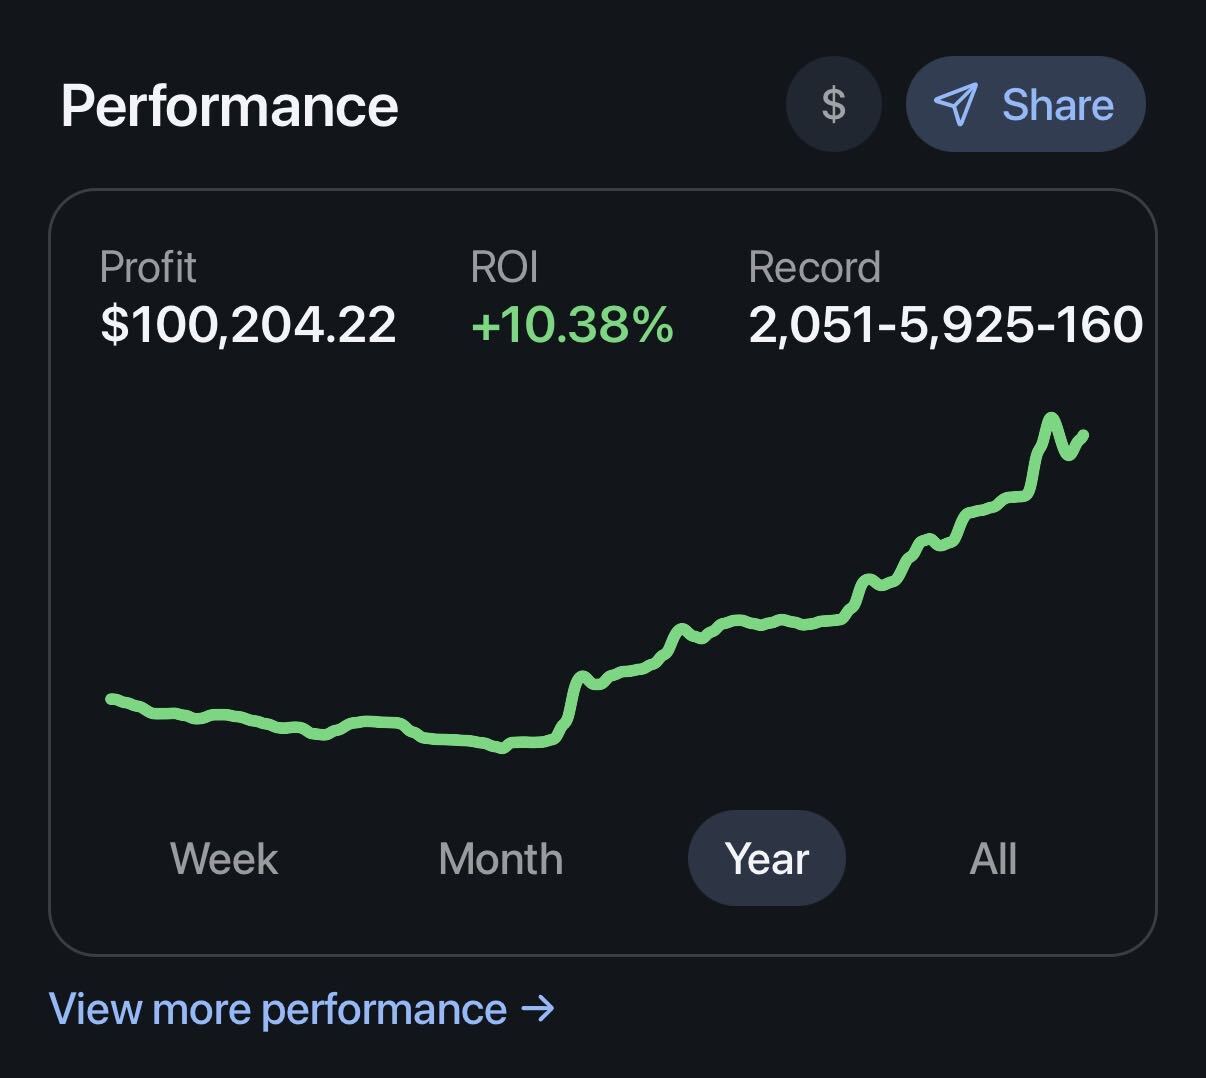
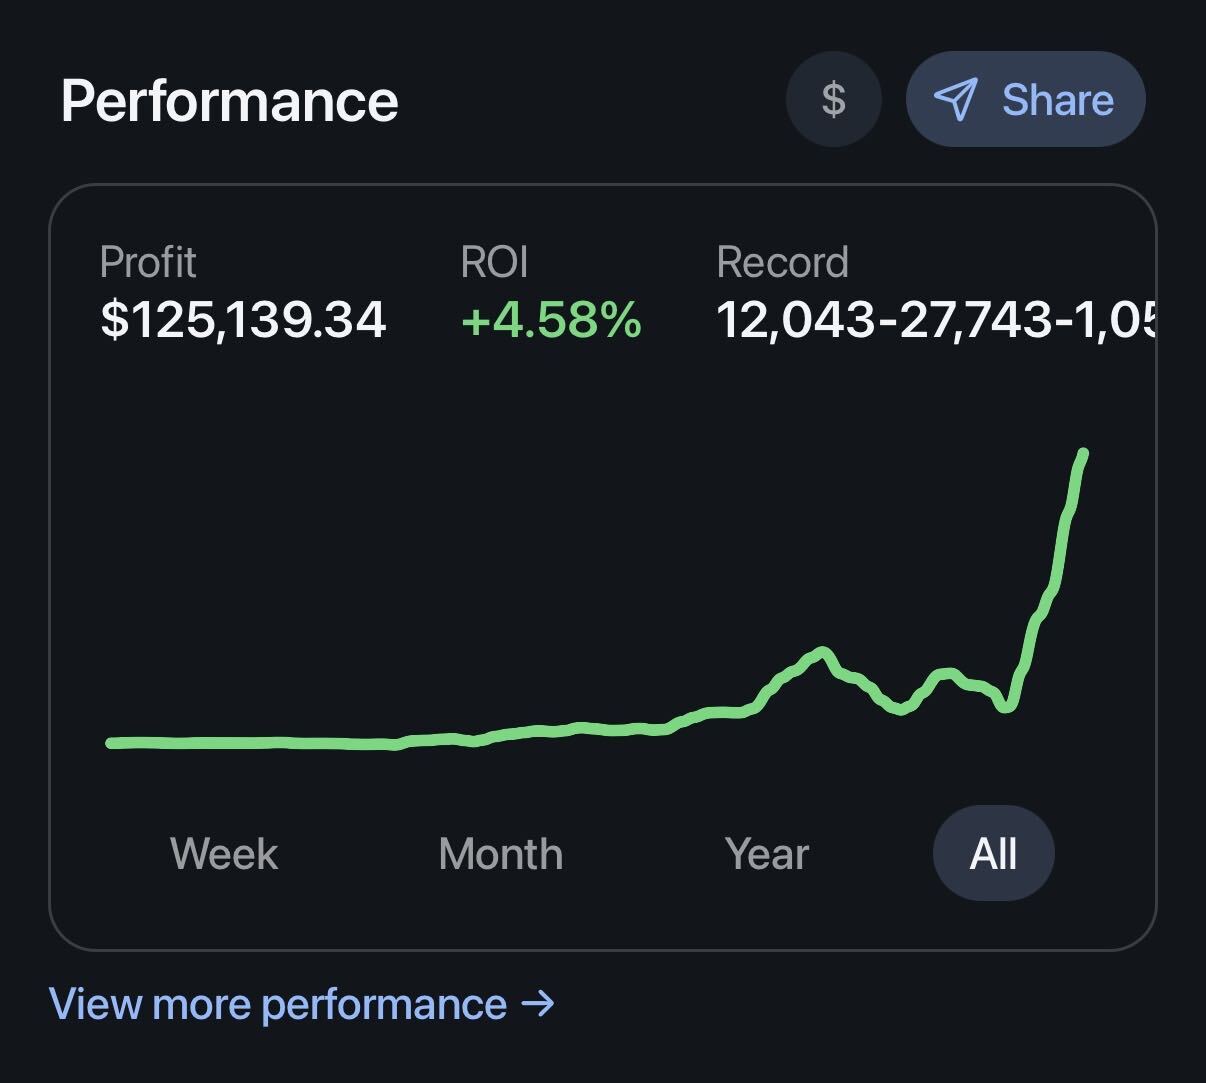
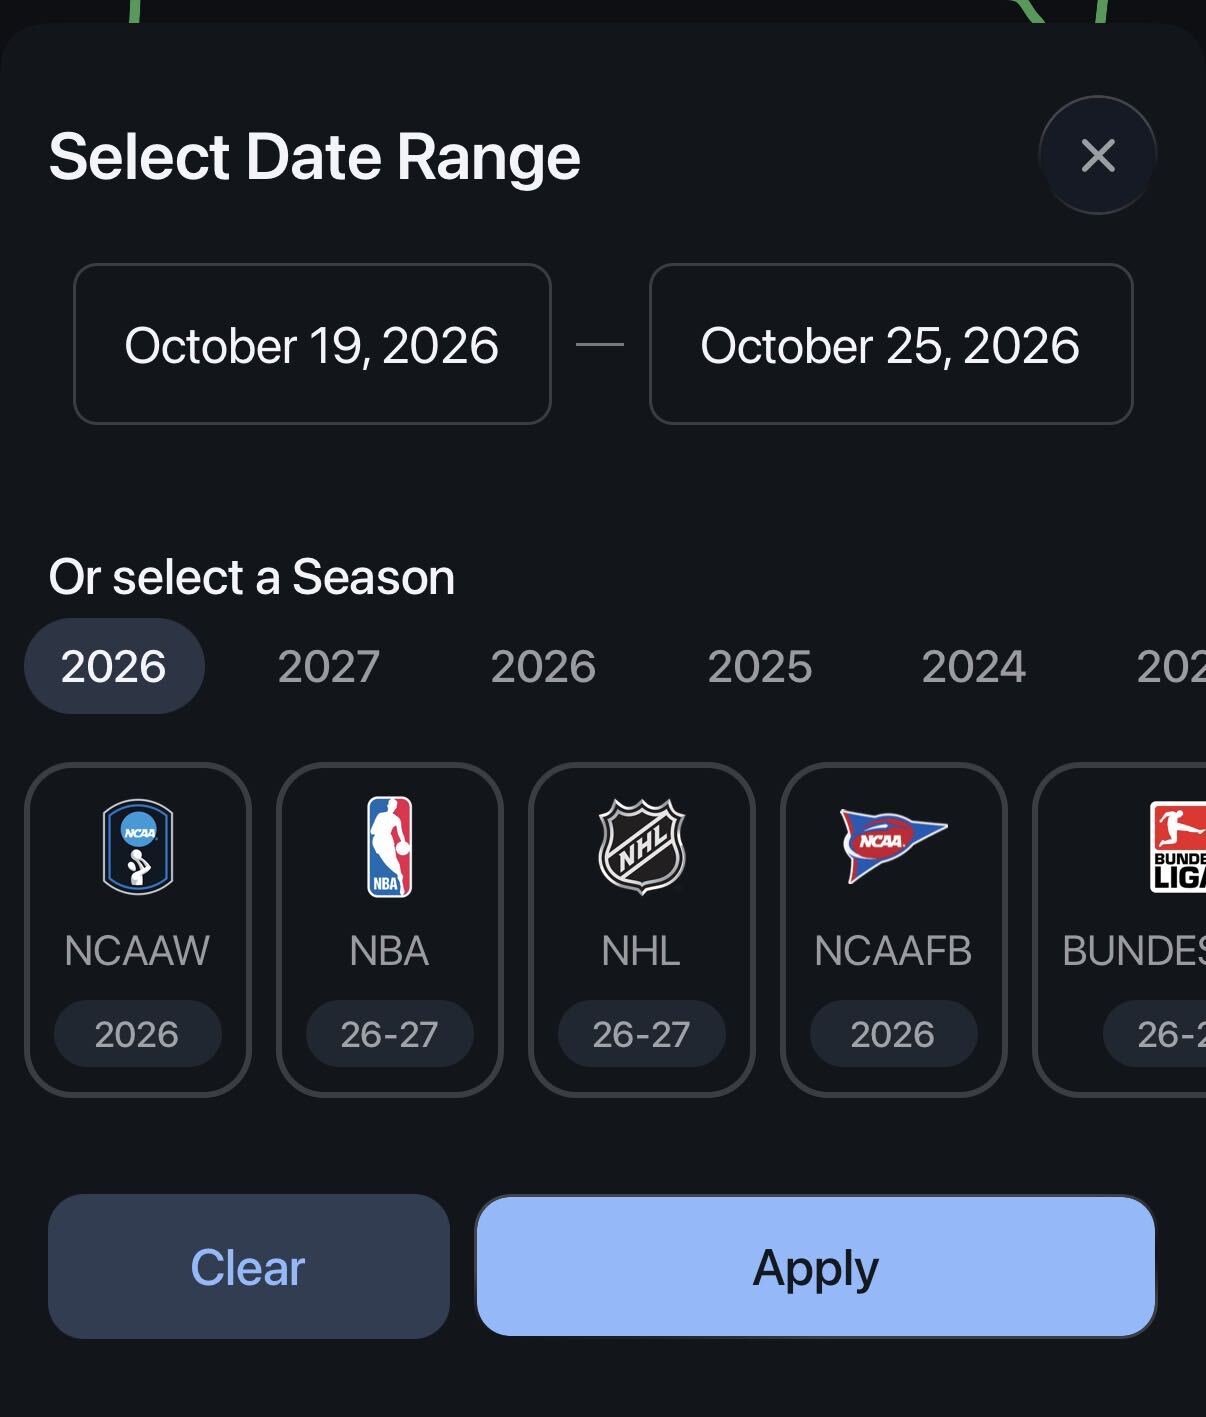
Inside Performance Center, you get two more timeframes on top of week, month, year, and all time: a custom date range or a full league season. Check your whole 2025 NFL season, or just the last two weeks.
Filter your bets by players, teams, leagues, sports, sportsbooks, bet types (straight, parlay, and other), bet categories (live bets, pregame, SGPs, and promos), market types, markets, your own tags, and saved filters.
Combine as many as you want. NBA player props at one sportsbook, live bets on your favorite team, or parlays from a single season. Every number on the page updates to match.
Build a filter once, save it, and it's one tap away from then on. Your go-to views, like NBA player props or live bets at one book, are ready whenever you want to check in.
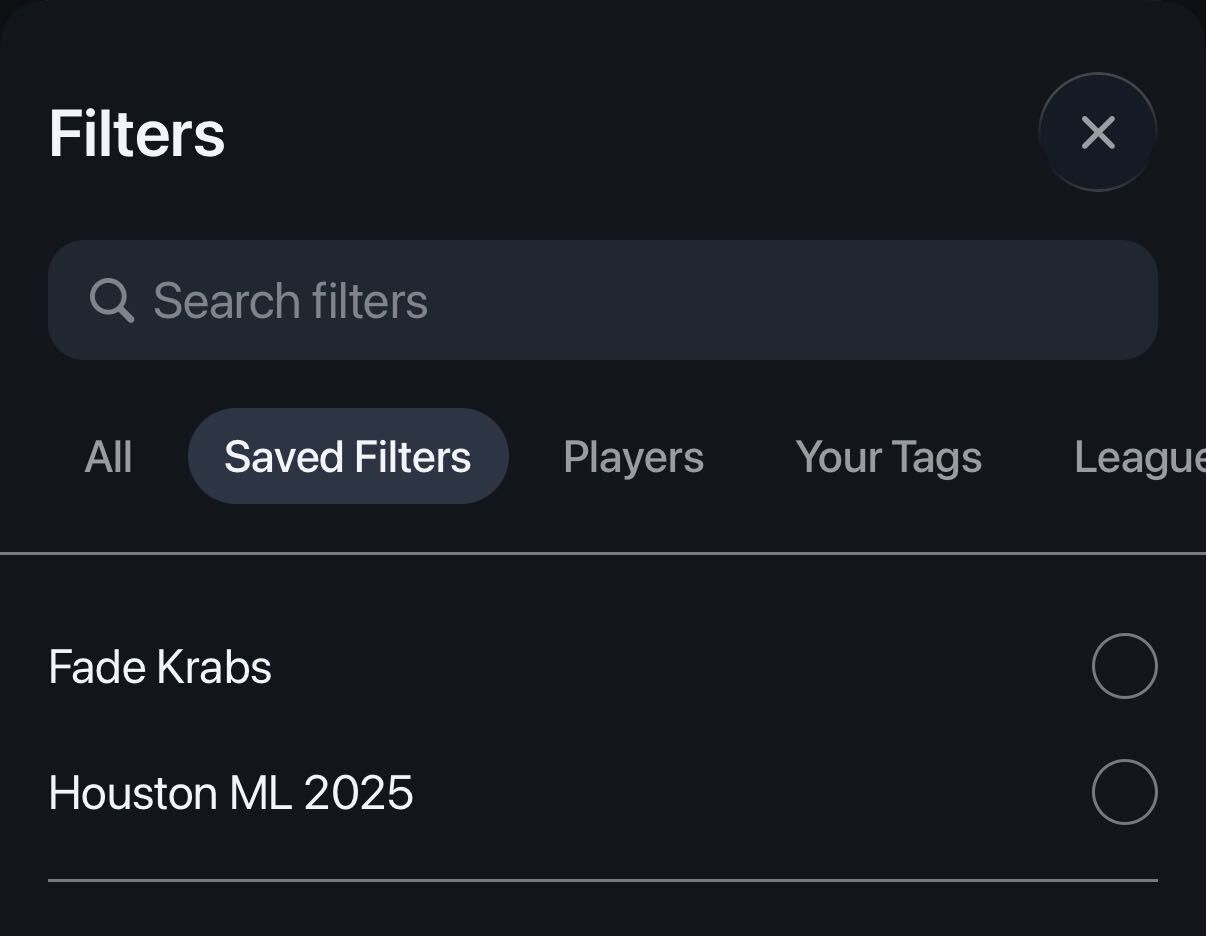
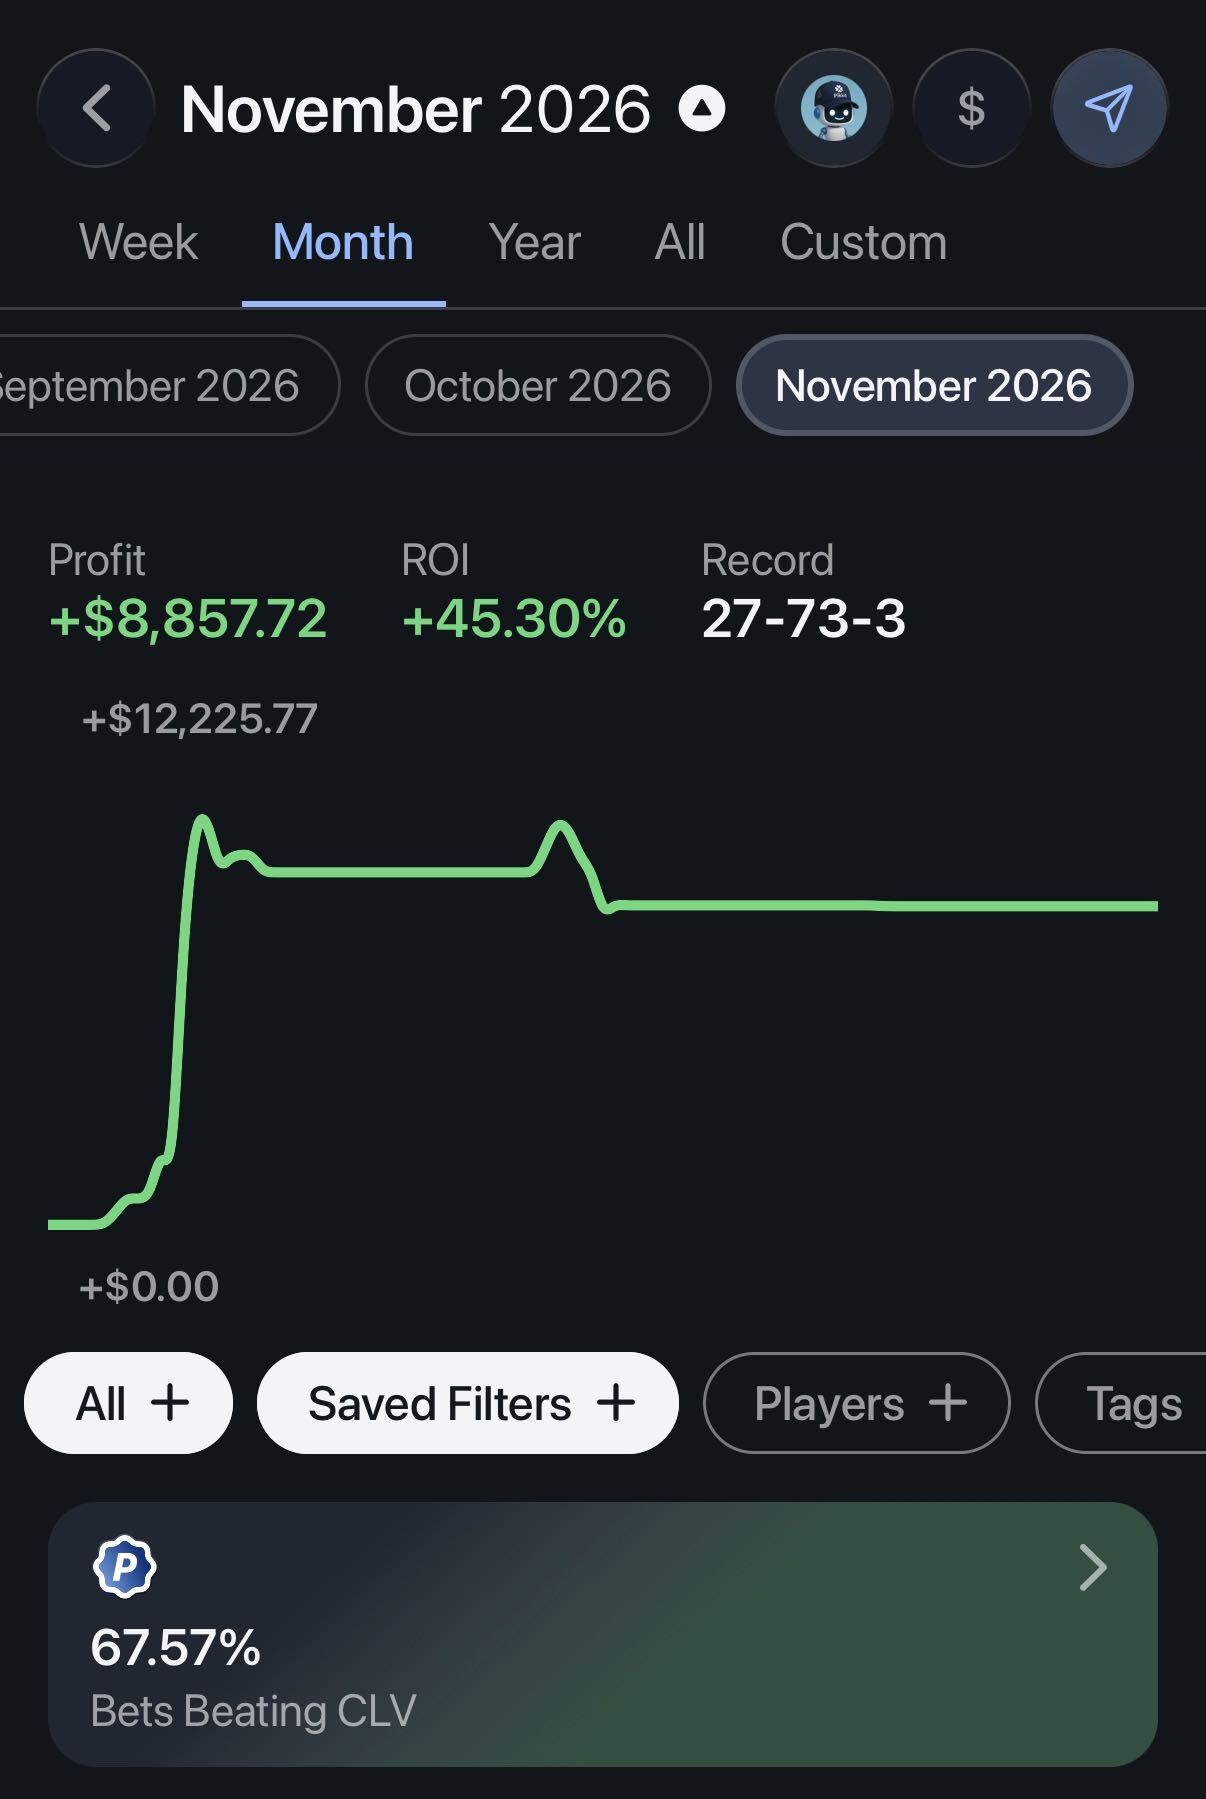
Every view shows the same three numbers: profit and loss, ROI, and record. That makes it easy to compare one slice of your betting against another.
Right under the graph, see how often the bets in your filter beat the closing line, like "70% of bets beating CLV." Tap it to open the CLV Center and go deeper. CLV is a Pikkit Pro feature.
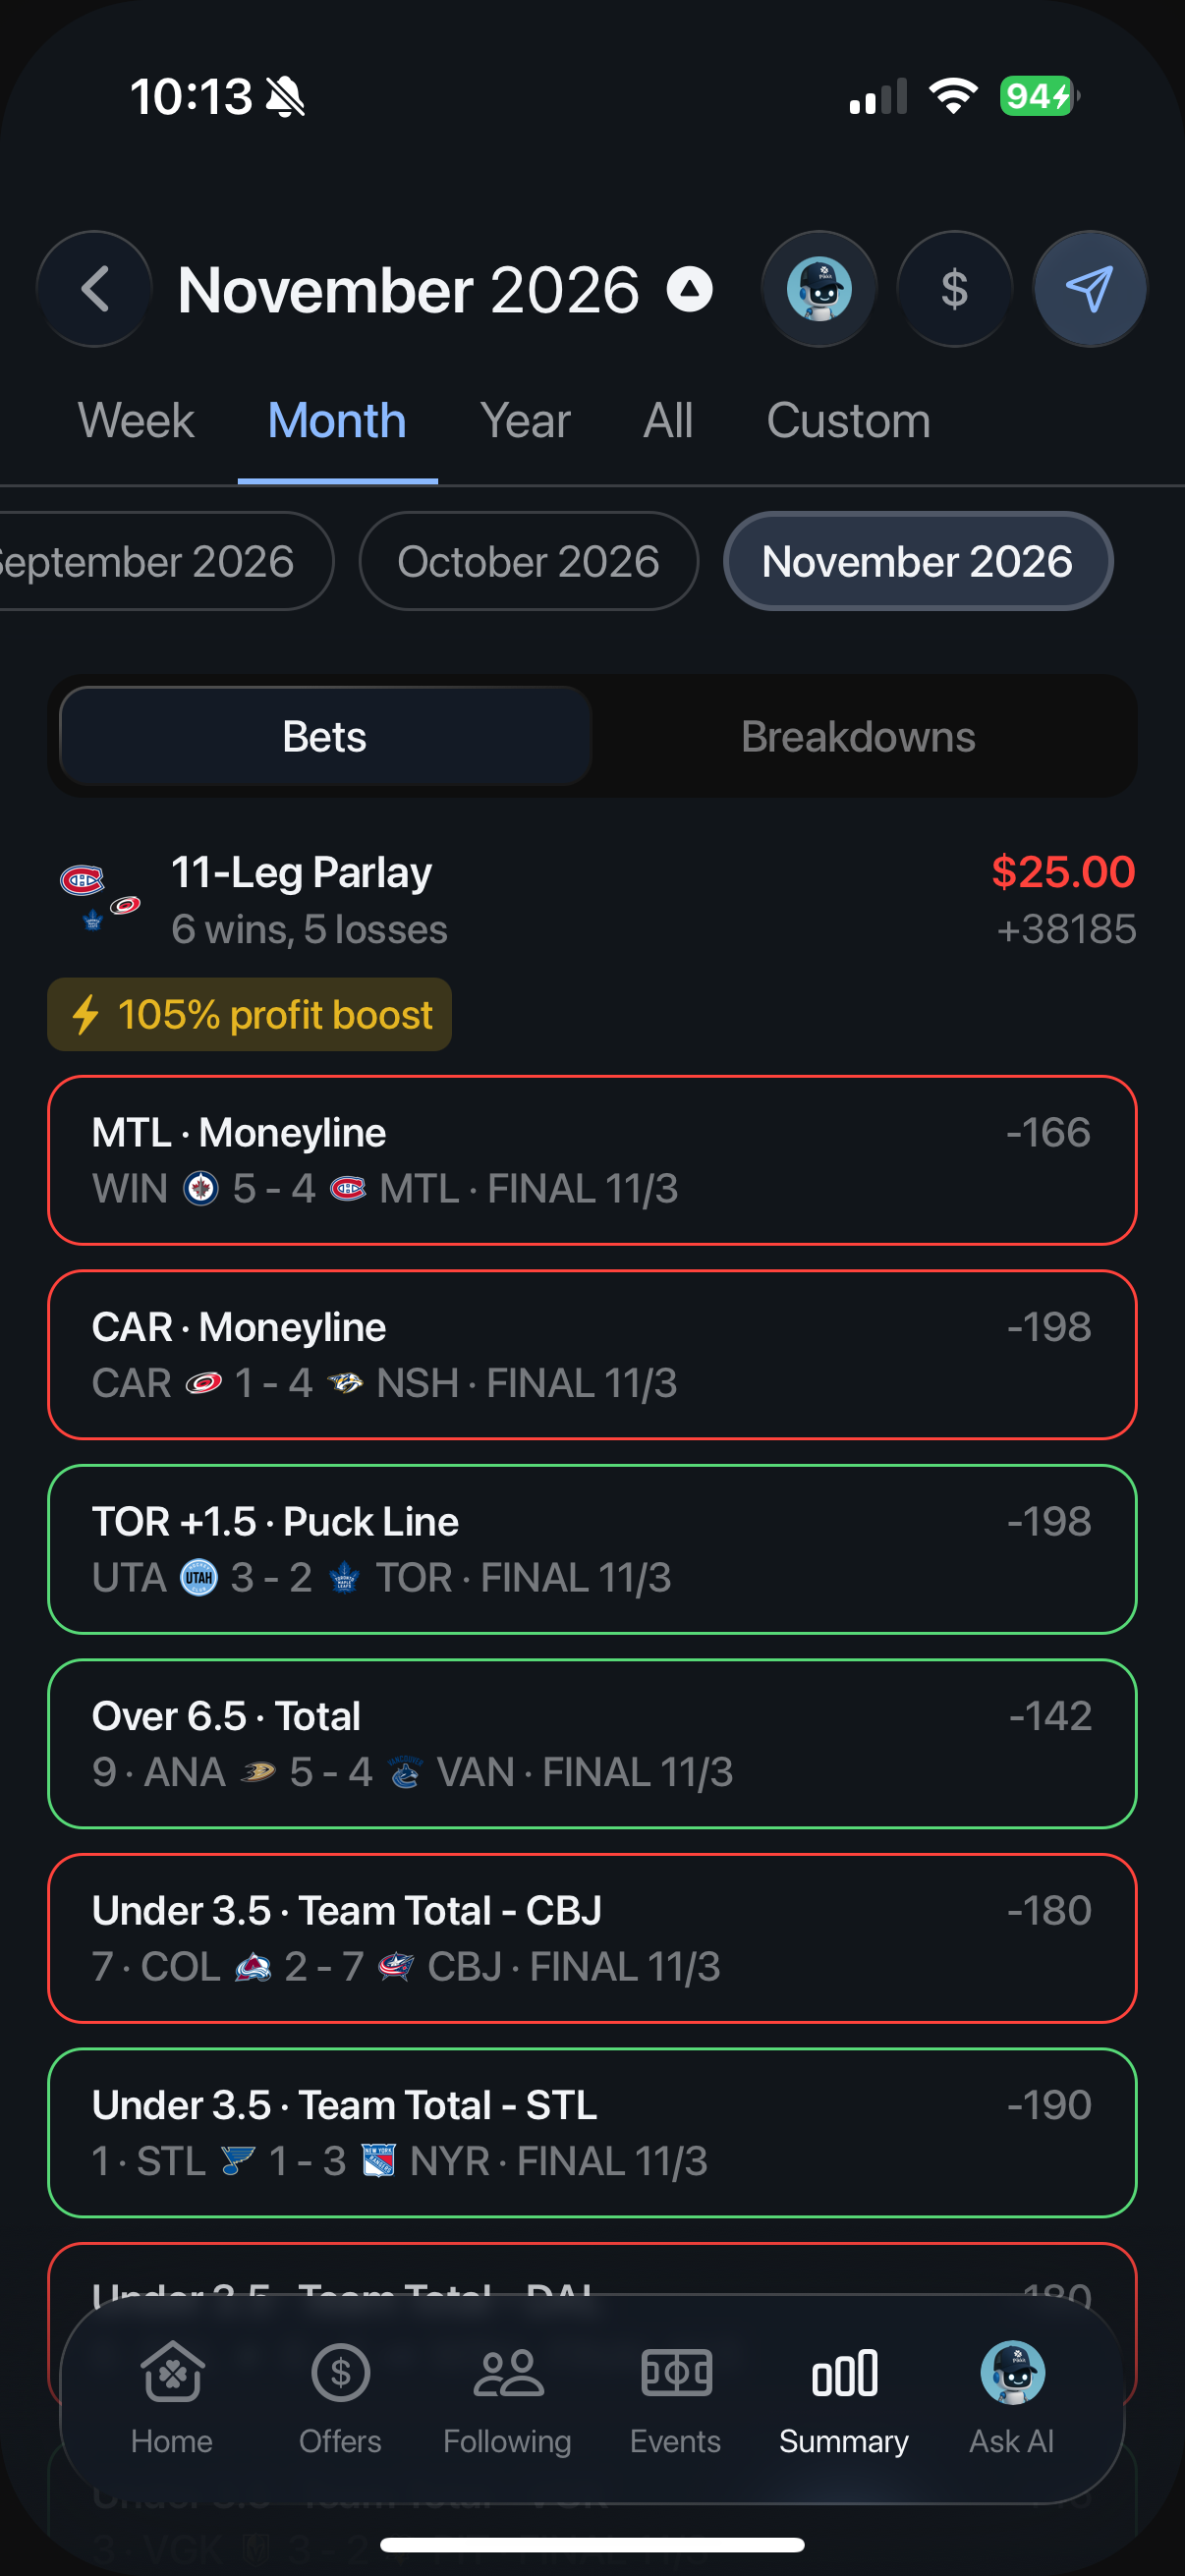
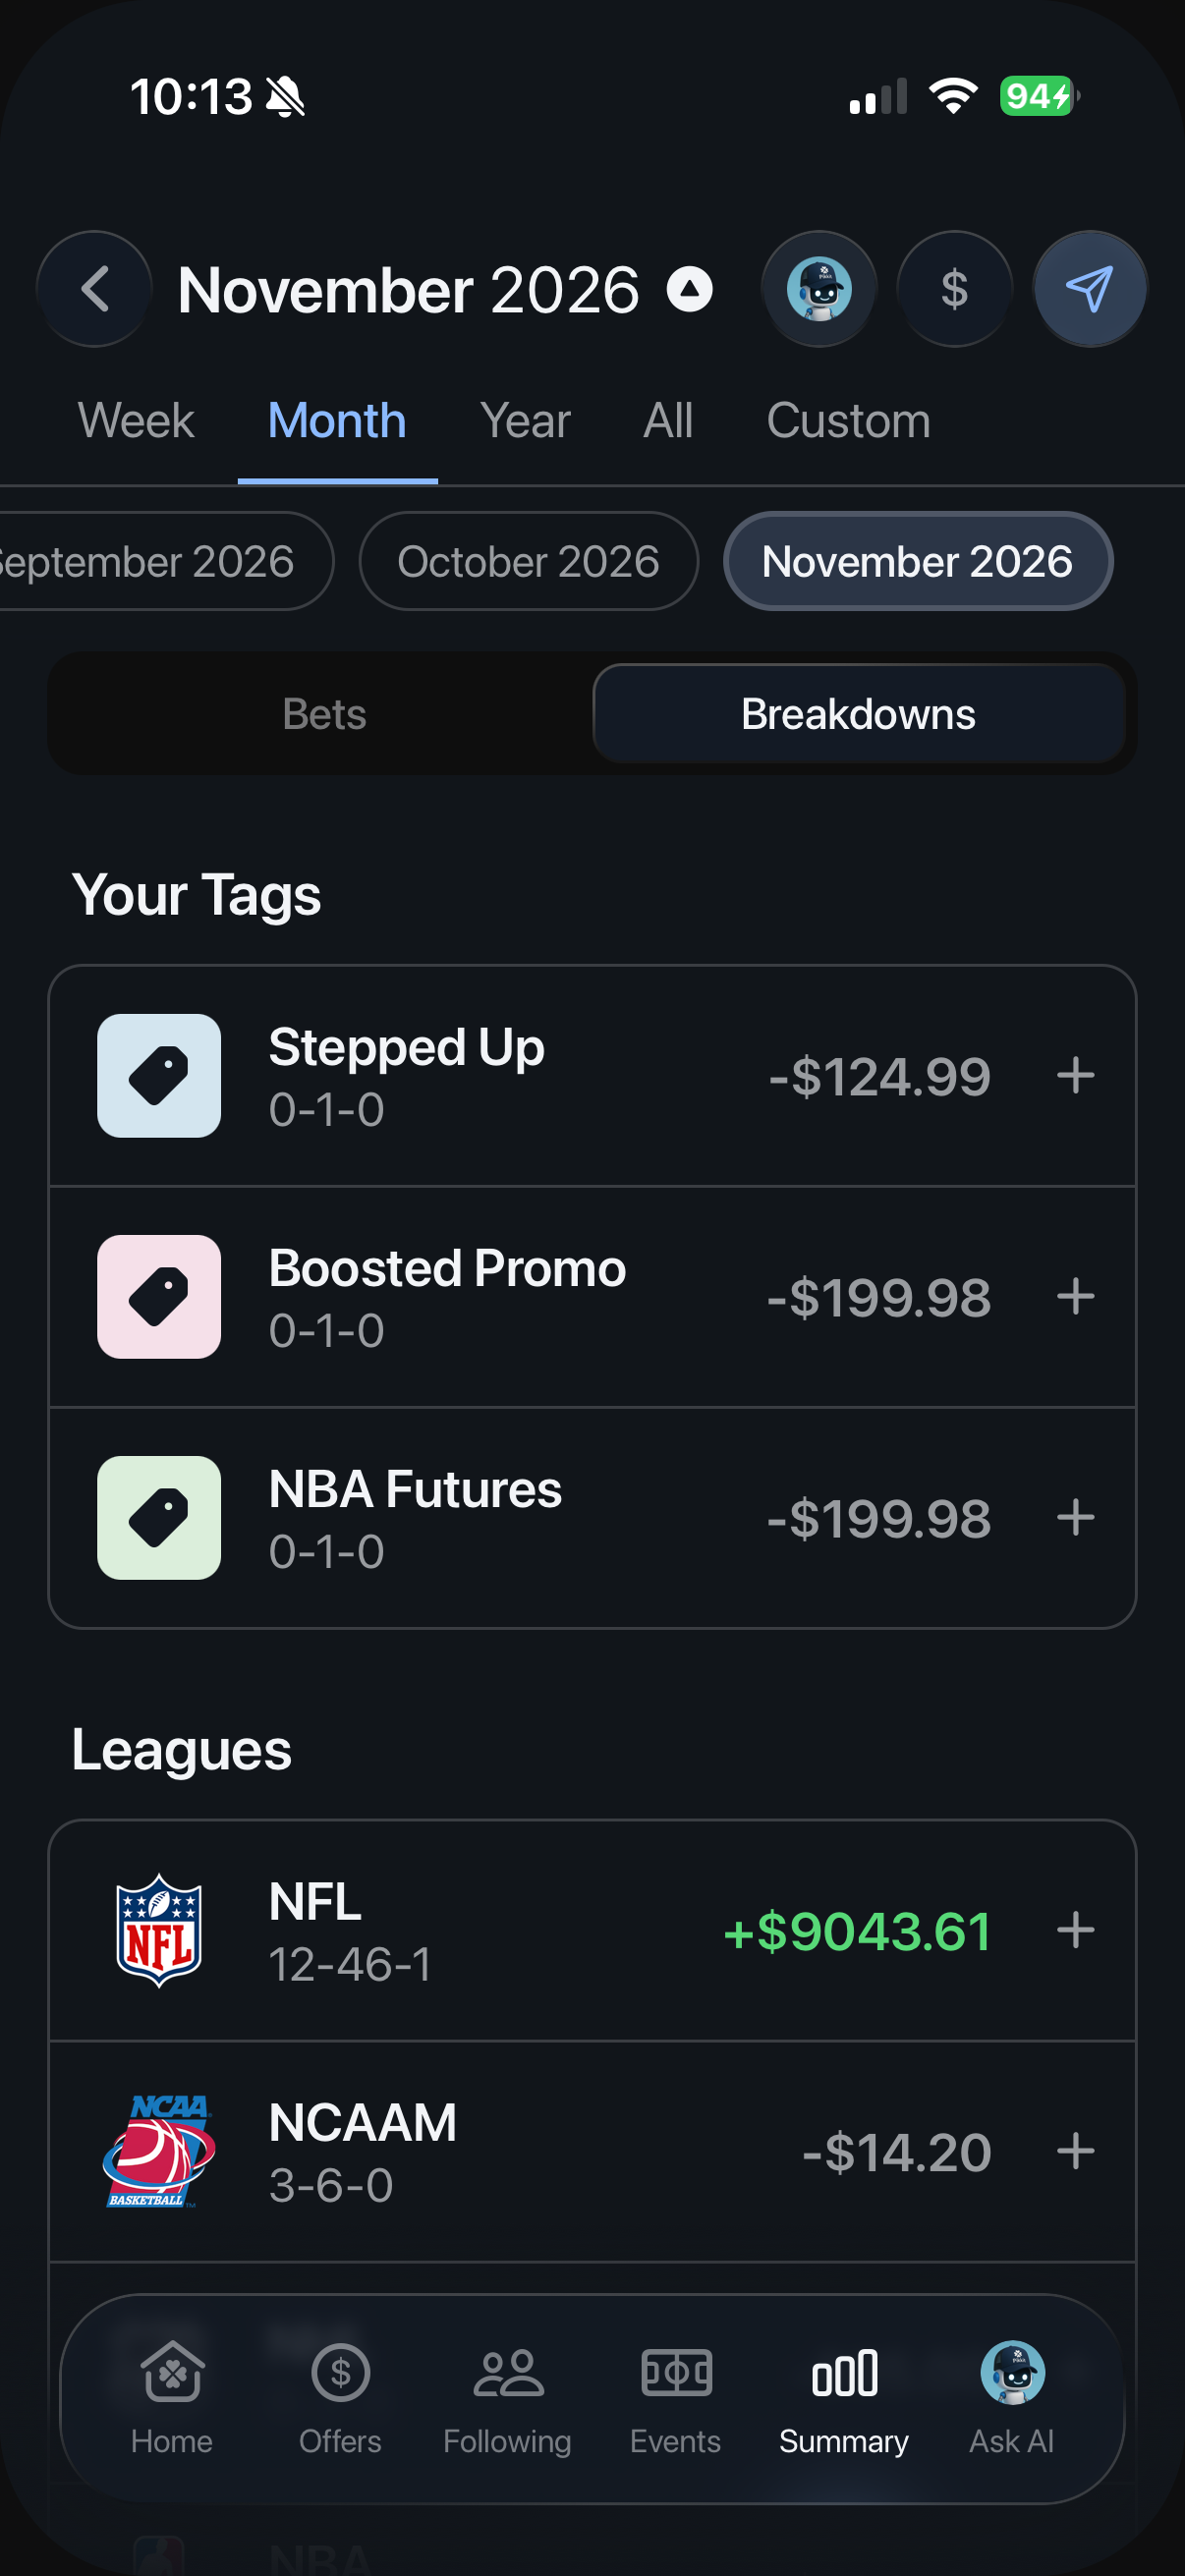
Below the graph, two tabs show what's behind your numbers.
The Bets tab lists every bet in your current filter, so you can see exactly what's driving the number.
The Breakdowns tab splits your filtered results 11 ways and shows your P/L for each: your tags, leagues, bet types, sportsbooks, sports, market types, futures, bet categories, teams, players, and markets. Tap any row and Performance Center opens filtered to that slice, with its own graph, P/L, ROI, record, and CLV. Start with all your bets, tap NBA, then tap player props, and you've drilled down in two taps.
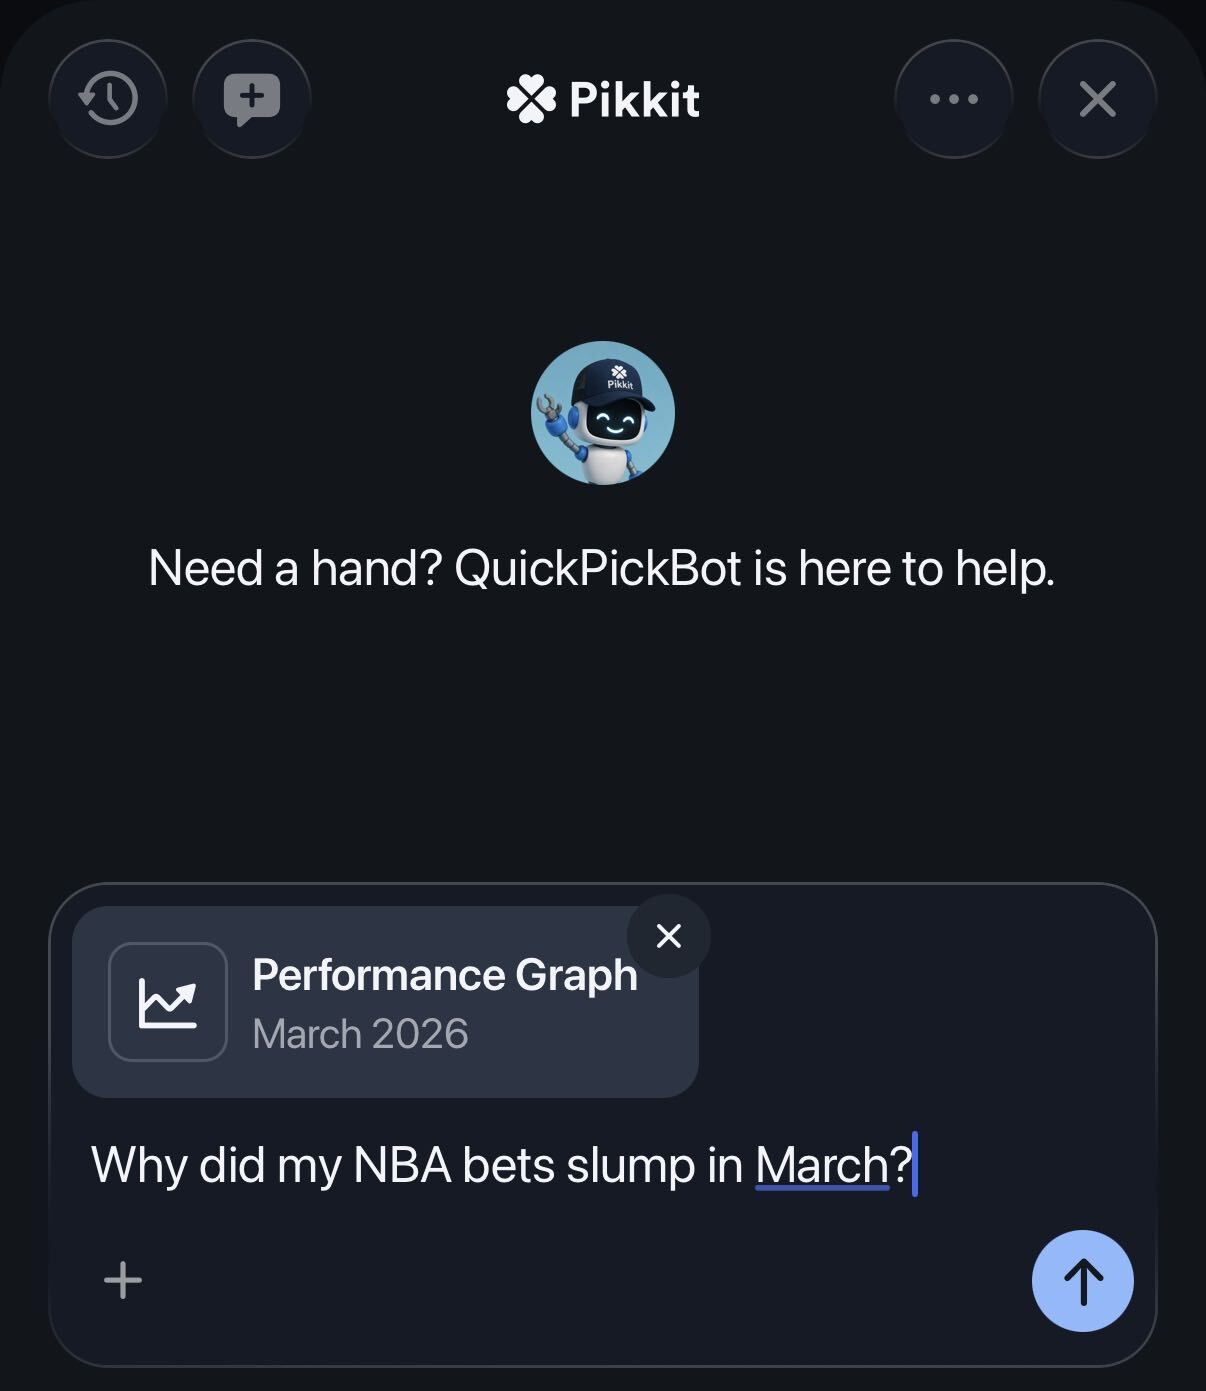
Tap the Pikkit AI button in the top right and Pikkit drops your filtered graph straight into the chat. Ask why your NBA props slumped in March, which sportsbook you do best at, or what your best stretch of the season had in common. Want to ask about something else? Remove the graph and start fresh.
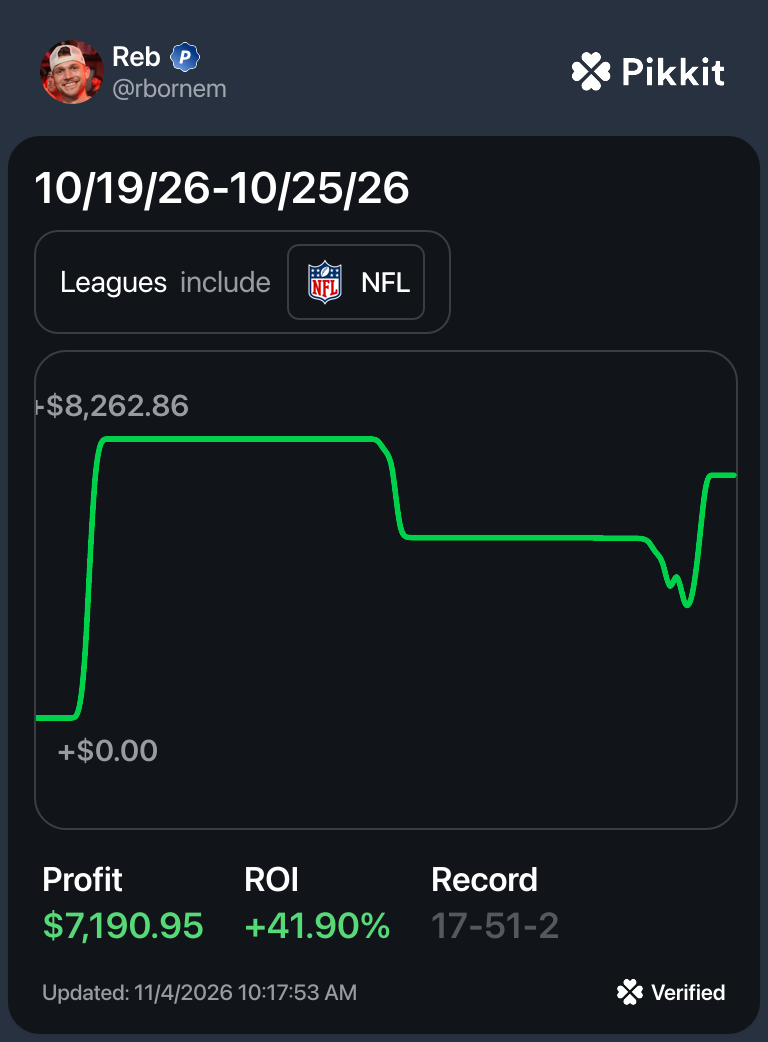
Tap share and Pikkit turns the graph you're looking at into a card, with the same filter, timeframe, P/L, ROI, and record. Anyone can post a screenshot of a spreadsheet. A Pikkit card comes from bets synced straight from the sportsbook, so the people you share it with know the results are real.
1. Sync your sportsbooks. Open Pikkit and sync the books you bet with through BookSync.
2. Open your Summary tab. Your Performance Center card shows your results for the week, month, year, or all time.
3. Flip between money and units to see results the way you size your bets.
4. Tap into Performance Center for custom date ranges and league seasons.
5. Add filters. Stack players, teams, leagues, sportsbooks, tags, bet types, and more.
6. Save the filter so it's one tap away next time.
7. Check your CLV under the graph, then open the Bets or Breakdowns tab to see what's behind the numbers.
8. Tap the Pikkit AI button to ask questions about the graph you're looking at.
9. Tap share to post a verified card of your results.
Getting the numbers in: a spreadsheet needs every bet typed in by hand. Performance Center builds itself from your synced sportsbooks.
Slicing the data: a spreadsheet needs a new formula or pivot table for every question. In Performance Center, it's one tap on a filter.
Finding the leaks: a spreadsheet won't tell you where you lose. The Breakdowns tab shows your P/L for every league, sportsbook, market, and tag at once.
Sharing it: a spreadsheet screenshot proves nothing. A Pikkit card comes from synced bets, so it's verified.
Performance Center runs on the same synced bets as your full bet tracker.
See the same results day by day, in green and red, on your Pikkit Calendar.
Ask questions about any graph in plain English with Pikkit AI.
See how CLV is calculated and why it matters on the closing line value page.
Your bets sync from 30+ sportsbooks through BookSync.
Yes. Performance Center is free, including every filter, saved filters, breakdowns, and sharing. The CLV breakdown is part of Pikkit Pro.
Performance Center is on the Summary tab in the Pikkit app. Tap into it for custom date ranges, league seasons, filters, and breakdowns.
No, Pikkit does not support manual bet entry. Every bet syncs from your sportsbooks through BookSync, so all stats are verified.
Pikkit syncs with 30+ sportsbooks, including DraftKings, FanDuel, BetMGM, Caesars, bet365, and Fanatics. See the full list of supported sportsbooks.
Yes. Flip between money and units anytime, on the Summary tab or inside Performance Center.
Yes. BookSync is read-only. Pikkit can see your bets and balance, but it can't place bets, move funds, or change anything in your account. Your login is encrypted, and your data is never sold.
